

There’s no magic hour that works for every TikTok account, and Buffer’s 2026 study admits as much. What it does highlight is a general preference for evenings and weekends. Still, the most reliable method is to compare the posting times of your own standout videos with those of your ordinary videos, instead of copying a market average.
What Buffer’s 2026 study says
Buffer analyzed 7.1 million posts published through its platform to map trends by day and hour. Its main findings:
- The best overall slot is Sunday at 9 a.m., followed by Monday at 1 p.m. and Sunday at 1 p.m.
- The best day is Saturday, followed by Monday and then Sunday.
- Engagement usually peaks between 6 p.m. and 11 p.m. Afternoons (noon to 5 p.m.) perform worst on average, with exceptions you can see in the table below: spikes around 1 p.m. (Monday, Thursday, Sunday) and on Saturday afternoon.
The day-by-day breakdown from the same study:
| Day | Best time | Runner-up times |
|---|---|---|
| Monday | 1 p.m. | 11 a.m., 8 a.m. |
| Tuesday | 6 a.m. | 10 p.m., 7 a.m. |
| Wednesday | 10 p.m. | 6 a.m., 9 p.m. |
| Thursday | 1 p.m. | 10 p.m., 6 a.m. |
| Friday | 6 p.m. | 10 p.m., 8 p.m. |
| Saturday | 5 p.m. | 4 p.m., 3 p.m. |
| Sunday | 9 a.m. | 1 p.m., noon |
Buffer itself points out an important limit: “There isn’t one ‘magic’ best time to post on TikTok for every creator.” It also acknowledges that other studies reach different conclusions, which shows how much the result depends on the dataset and the audience analyzed. On the plus side, its times are adjusted to apply as-is in your own time zone: 1 p.m. means 1 p.m. where you are, with no conversion needed.
Why posting time still matters
TikTok doesn’t document posting time as a ranking factor in itself. Its effect is indirect: by posting when your audience is active, you raise the odds of quick reactions in the first hour, and according to many creators’ observations, those early reactions influence whether TikTok shows the video to a wider audience. Our guide to the TikTok algorithm in 2026 covers the actual signals the recommendation system uses. Posting at the right time gives you a better head start; it never makes up for content that doesn’t hold attention.
Why market averages can mislead you
A study like Buffer’s pools millions of posts from very different accounts, niches and countries. A B2B educational creator and a mainstream entertainment account don’t have the same audience online at the same hours. A global average smooths out those differences and can push you toward a slot that has nothing to do with how your niche behaves.
It’s the same bias you find in engagement rate benchmarks: a market average gives you a ballpark figure to check against your own account. See our guide to the average engagement rate on TikTok and Instagram for the same reasoning applied to engagement.
The recommended method: start from your own data
Rather than copying a generic table, the most reliable method combines two sources:
- Your own audience analytics. In TikTok Studio, the audience analytics show the hours and days when your followers have been most active recently.
- The posting times of your standout videos. Look at which of your last 20 videos clearly beat your own median, and at what time they were posted. If several of them share a time slot, you have a signal specific to your account, far more reliable than an average pooled across millions of unknown accounts.
A four-week test plan
Here’s a simple way to test this method without spending hours on it:
- Weeks 1 and 2: post at your usual times without changing anything, and log the exact time of each post in a simple spreadsheet.
- End of week 2: calculate the median views of those posts, then identify the ones that clearly beat it.
- Weeks 3 and 4: concentrate your posts on the time slot or slots that keep showing up among your best videos, keeping everything else the same (format, length, tone).
- Compare the two periods. If your median views go up in weeks 3 and 4, the slot you tested is probably a good fit for your audience. If nothing changes, timing likely wasn’t the bottleneck, and you’re better off looking at the content itself.
The advantage of this approach is that it doesn’t rely on any outside average: it isolates the effect of timing on your own account, with your content variables held constant.
Applying this logic across a watchlist
The same method works even better when you compare several accounts in your niche. In Creadar, a video is flagged as an outlier when its views or engagement reach 3 times the median of its own creator’s last 20 eligible videos. By looking at when the outlier videos were posted across a watchlist of comparable accounts, you get a pattern drawn from your actual niche instead of an average across all audiences.
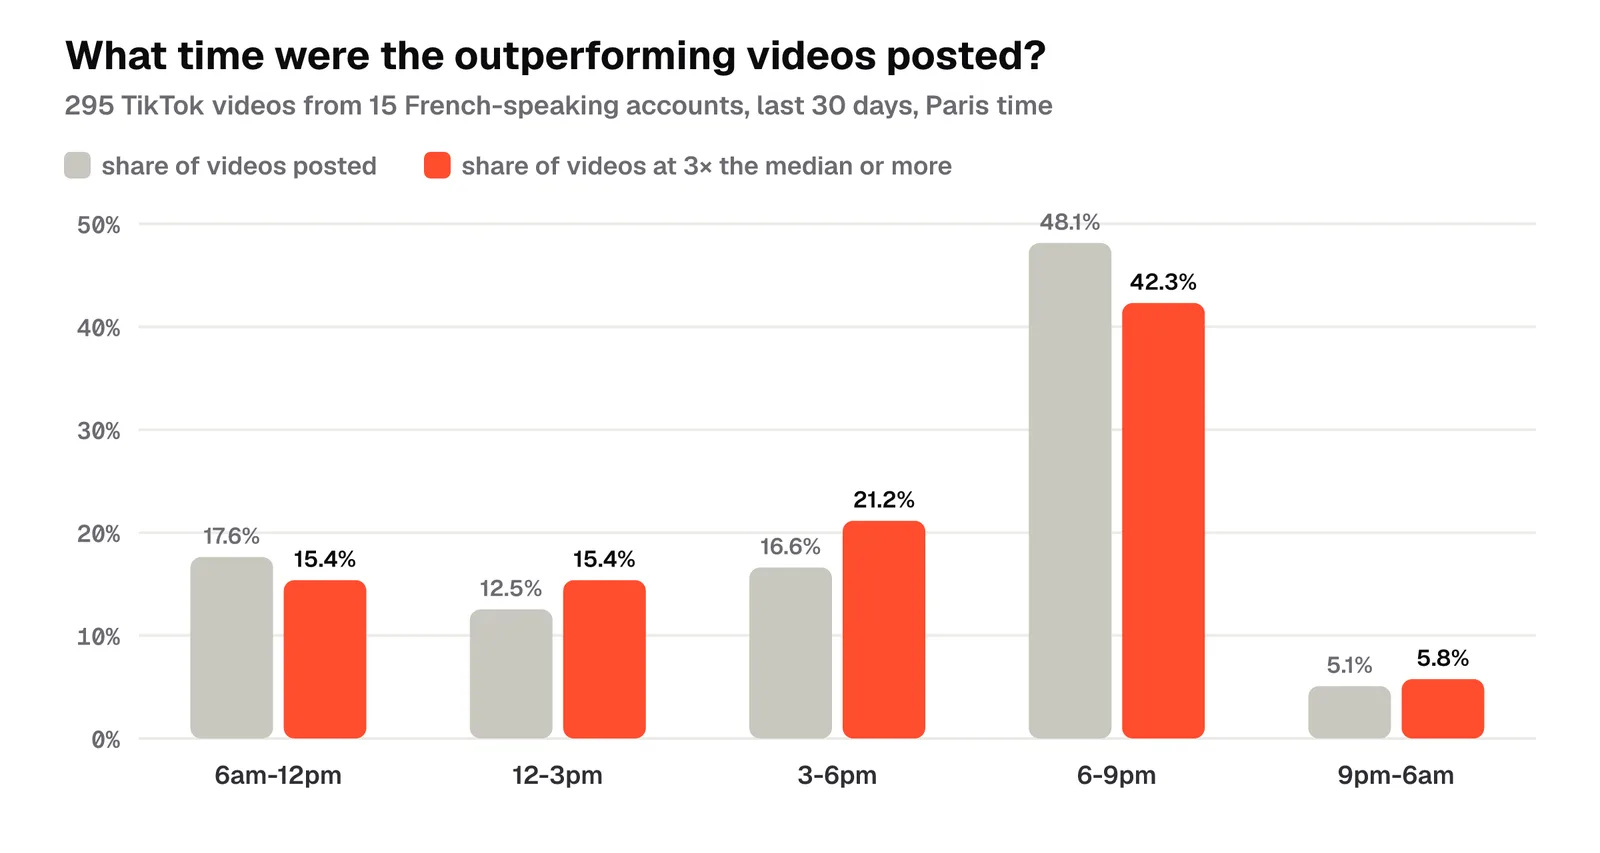
In this sample, nearly half of the videos (48.1%) are posted between 6 p.m. and 9 p.m., right in the evening window that Buffer’s study highlights. Yet that slot produces only 42.3% of the videos that reach 3 times their creator’s median: a video posted then had about a 15% chance of outperforming, versus about 22% between noon and 6 p.m. The sample is small (52 outlier videos) and only applies to these accounts. Above all, it shows that the most crowded slot isn’t necessarily the best one for a given niche.
This approach has one more advantage: it updates itself. An audience’s active hours shift over time (school breaks, seasons, daylight saving time), while a table published once a year goes stale without anyone noticing.
When your audience spans several time zones
If your audience is spread across several time zones, for example part in the US and part in the UK or Australia, no single hour can suit everyone at once. Two approaches work in that case: post at a slot that overlaps the most active time zones at the same time, or post twice a day, explicitly targeting each region, if your production pace allows it. To choose, start from your followers’ activity hours in TikTok Studio instead of guessing them.
Why weekends stand out in Buffer’s study
In Buffer’s study, Saturday ranks as the top day, ahead of Monday and Sunday, and two of the week’s three best slots fall on a Sunday. A plausible explanation has more to do with habits than with the algorithm: on weekends, many users have more free time and less fragmented sessions. More available watch time means a better chance that a video posted then gets quick reactions.
That doesn’t mean weekends work for every account: a B2B creator whose audience checks TikTok during work breaks on weekdays may well get better results on a Tuesday afternoon than on a Saturday night.
Summary table: generic approach vs. data-driven approach
| Generic approach (market study) | Approach based on your own data | |
|---|---|---|
| Source | Average across millions of unknown accounts | Your audience analytics and your standout videos |
| Reliability for your niche | Low to medium | High |
| Setup cost | None, ready-to-use number | A few weeks of observation |
| Updates | Updated yearly by the study | Updates with every new post |
| Best for | Getting started with no data | Fine-tuning a strategy already in place |
Common TikTok timing mistakes
- Changing your posting time with every post. Let a slot run for several weeks before judging it, because a TikTok video’s performance varies enormously from one day to the next regardless of the time.
- Putting timing ahead of content. Buffer says it outright: “even the best timing in the world can’t ‘save’ a weak post.” The hook and retention matter more.
- Ignoring the day of the week. Many creators optimize the hour without noticing that the day changes everything: a great time on a Saturday can be mediocre on a Wednesday.
What if my views never take off, whatever the time?
If your views stay unusually low across several posts in a row, whatever slot you test, the problem probably isn’t the time. Before you keep adjusting your schedule, check that your account isn’t affected by a deeper visibility restriction: see our guide to TikTok shadowbans to tell normal variance from a real problem.
The bottom line
Buffer’s study points to a general trend (evenings, weekends) without naming a single best time, and says so itself. Use it as a starting point. The most reliable data is still your own: your followers’ real activity, and the posting times of the videos that truly outperformed against your own history. By applying the same analysis to comparable accounts tracked in a watchlist, you get a niche signal that market averages can’t give you.
To find those comparable accounts and follow their posts over time, see our comparisons of the best TikTok competitor analysis tools and the best TikTok trend tools.