

Engagement rate measures interactions (most often likes and comments) relative to views or followers, depending on the method. On TikTok, Socialinsider’s 2026 report puts the average between 3.85% and 4.20% of views, depending on the period. On Instagram, it sits between 0.45% and 0.48% of followers, down year over year. These market averages are mostly a reference point: the real question is whether a video beats the usual baseline of the account that posted it.
The engagement rate formula
There’s no single universal formula, which is a common source of confusion when you compare figures from different sources. The most common variants:
- Engagement by views: (likes + comments) ÷ views × 100. This is the formula Creadar uses for every tracked video, provided its likes and comments are available and it has at least one view.
- Engagement by followers: (likes + comments) ÷ followers × 100. This is the method Socialinsider uses for Instagram in its 2026 report.
- Extended engagement: (likes + comments + shares + saves) ÷ views × 100. This is Socialinsider’s formula for TikTok, so its TikTok averages count more interactions than engagement by views above.
Before you compare two figures, always check which formula was used. A 4% rate by views and a 4% rate by followers measure completely different things.
Average TikTok engagement rate in 2026
According to Socialinsider’s 2026 TikTok benchmarks, based on organic videos from brand accounts with 1,000 to 1 million followers:
- The average engagement rate by views rose from 3.85% in 2024 to 4.20% in 2025, a 9% increase in one year.
- The report is updated every quarter: for 2026, it shows an average of 3.85% over the first half, then 3.90% in the third quarter.
| Account size | Engagement 2024 | Engagement 2025 |
|---|---|---|
| 1-5K followers | 4.20% | 4.40% |
| 5-10K followers | 3.85% | 4.00% |
| 10-50K followers | 3.80% | 3.90% |
| 50-100K followers | 3.75% | 3.75% |
| 100K-1M followers | 3.95% | 3.95% |
Source: Socialinsider, 2026 TikTok Benchmarks.
Average Instagram engagement rate in 2026
Socialinsider’s 2026 Instagram report, based on organic posts from brand accounts with 1,000 to 1 million followers, calculates engagement against followers and shows the opposite trend to TikTok:
- In 2025, the average engagement rate across all formats was 0.48%, down about 24% year over year.
- Carousels remain the most engaging format, at 0.55% in 2025 (flat compared with 2024).
- Reels follow at 0.52% in 2025 (up from 0.50% in 2024).
- Static images drop sharply, to 0.37% in 2025 from 0.45% in 2024, a 17% decline.
- In the third quarter of 2026, the report’s latest update, the average across all formats is 0.45%.
| Format | Engagement 2024 | Engagement 2025 |
|---|---|---|
| Carousel | 0.55% | 0.55% |
| Reels | 0.50% | 0.52% |
| Images | 0.45% | 0.37% |
Source: Socialinsider, 2026 Instagram Organic Engagement Benchmarks.
Beyond the rate: likes and comments per TikTok video
Engagement rate can hide different trends depending on the type of interaction. Again according to Socialinsider, here is the average number of likes and comments per video by account size:
| Account size | Likes 2024 | Likes 2025 | Comments 2024 | Comments 2025 |
|---|---|---|---|---|
| 1-5K followers | 320 | 330 | 7 | 8 |
| 5-10K followers | 575 | 595 | 10 | 15 |
| 10-50K followers | 1,225 | 1,325 | 23 | 25 |
| 50-100K followers | 2,177 | 2,675 | 37 | 40 |
| 100K-1M followers | 6,402 | 7,900 | 90 | 100 |
Average per video. Source: Socialinsider, 2026 TikTok Benchmarks.
Up to 10,000 followers, comments grow faster than likes: for accounts with 5,000 to 10,000 followers, they go from 10 to 15 per video (+50%), while likes gain about 3%. Between 10,000 and 50,000 followers, both grow at the same pace (about +8%). Above 50,000 followers, likes pick up speed (+23%), far ahead of comments (+8% to +11%). In every bracket, comments stay rare: between 1.3 and 2.5 per 100 likes in 2025.
Why comparing TikTok and Instagram head to head is misleading
A figure of 4.20% on TikTok and 0.48% on Instagram doesn’t mean TikTok generates nine times more real engagement: the two denominators are different. TikTok is measured here against views (people who have already seen the video), Instagram against followers (people who haven’t necessarily seen the post). The numerator changes too: Socialinsider counts shares and saves for TikTok, but only likes and comments for Instagram. To compare the two platforms fairly, you’d have to recalculate one of the two figures with the same formula, which neither of the reports cited here does.
Why your own median matters more than a market average
In Creadar, each video’s engagement rate sits next to the creator’s median over their last 20 eligible videos, and a video is flagged as an outlier when its views or engagement reach 3 times the matching median. A creator whose usual rate is 2% and who posts a video at 3% beats their baseline, even if 3% is still below the average quoted in a general report. Conversely, a creator used to 8% engagement who drops to 5% is still above a market average while clearly falling short of their own normal performance.
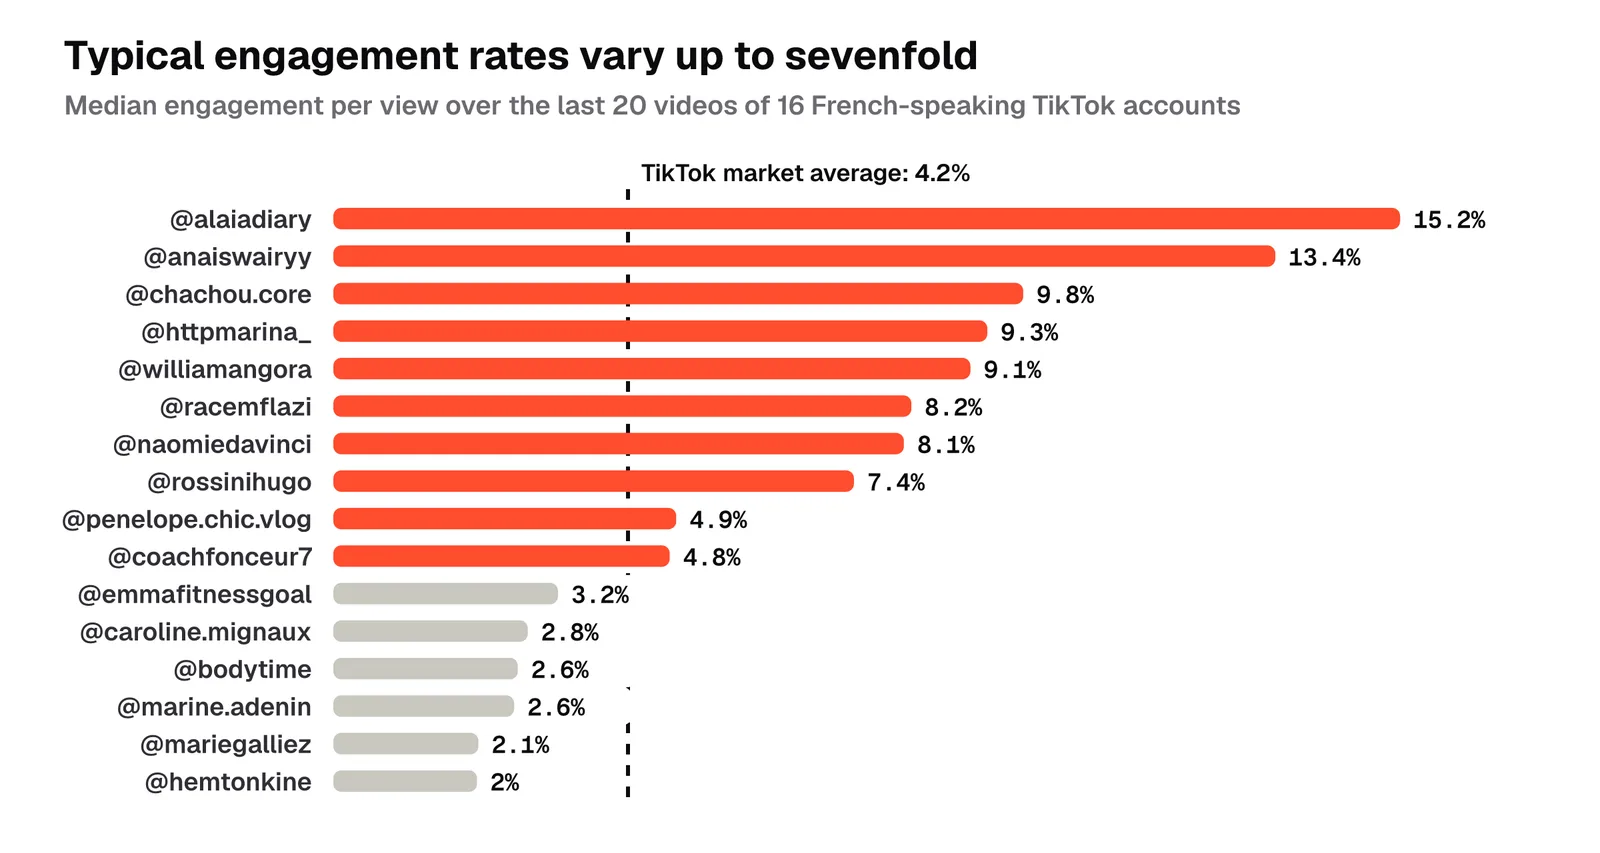
Across these 16 French-speaking accounts tracked in Creadar, usual engagement ranges from 2% (@hemtonkine) to 15.2% (@alaiadiary). The 4.2% line works as a visual reference, but it can’t be compared one-to-one with the bars, since Socialinsider also counts shares and saves. Next to it, the first account looks weak and the second exceptional. Yet a @hemtonkine video at 5% would be well above its baseline, while an @alaiadiary video at 8% would be well below its own. Only the creator’s median tells the two apart.
Small accounts still lead on TikTok
In the TikTok table above, the smallest accounts (1,000 to 5,000 followers) stay on top, at 4.40% in 2025. The decline with size isn’t steady, though: accounts with 100,000 to 1 million followers (3.95%) do better than those with 50,000 to 100,000 (3.75%). Socialinsider’s Instagram report, for its part, doesn’t publish engagement rates by account size.
As Socialinsider puts it in its TikTok report, engagement isn’t something you “carry” with you as your follower count grows: you have to keep earning it back. A fixed engagement rate target makes little sense over time. A good rate at 2,000 followers isn’t necessarily a good rate at 200,000, and vice versa.
How to raise your engagement rate above the market average
Socialinsider’s TikTok report suggests concrete levers to beat the average:
- Build content for interaction. Asking an open question, inviting people to share their opinion or leaving a point unresolved prompts more comments than closed, purely informational content.
- Show faces. The report recommends featuring real people (creators, team members, founders) rather than overly corporate content.
- Turn a format that works into a recurring series. Instead of moving on to the next topic after a hit, spinning the same format into several episodes builds on the interest you’ve already created.
- On Instagram, favor carousels. According to Socialinsider’s Instagram report, they’re both the most engaging format and the one that earns the most saves.
These levers don’t cancel out the decline seen on Instagram in 2025, but they give you ways to beat the average in your category.
Common mistakes when reading engagement rate
- Treating the market average as an absolute target. An account in a high-interaction niche can clear the overall average with no special effort, while another in a more passive niche struggles to reach it despite good content.
- Ignoring change over time. Market averages move from one year to the next (TikTok rose 9% between 2024 and 2025, Instagram fell 24%), so a frozen number quickly goes out of date.
- Judging a single video on engagement alone. A video can show a strong engagement rate on very few views, which says little about its actual reach: always cross-check the rate with view volume.
The bottom line
Market averages give you an order of magnitude: about 4% of views on TikTok and about 0.5% of followers on Instagram, according to Socialinsider. Their formulas differ, so the two can’t be compared with each other, and on TikTok the smallest accounts stay on top. To judge a video, the most actionable benchmark is the median of recent posts from the same account, which reflects your niche and your audience better than a general average.
To go further on reading performance in relative terms, see our guides on how many views it takes to go viral on TikTok and on the TikTok algorithm in 2026. To track these rates over time across several accounts, check out our comparison of the best creator performance tracking tools.